The ActiveEye Dashboard
The Dashboard page is the first page that appears when you log in to ActiveEye, designed to be your central hub for security insight. The purpose of the Dashboard is to provide a broad view of actions taken within the ActiveEye system, with functions you can use to further drill-down and investigate data of interest.
You can enable the auto-refresh feature to automatically reload the Dashboard every 15 minutes, keeping your view up-to-date without requiring a manual page refresh. To enable auto-refresh, click your email address in the upper-right corner of any page in ActiveEye, and then, in the menu that appears, click Account Profile. Then, on the page that appears, select the Enable Auto-Refresh checkbox.

If you have multiple tabs open, refresh each them to apply this change.
See the Accessing the ActiveEye Insight view of the Dashboard section of this topic for instructions on accessing the Dashboard’s kiosk mode. This view provides a read-only, automatically refreshing snapshot of the Dashboard that is optimized for wall-mounted monitors.
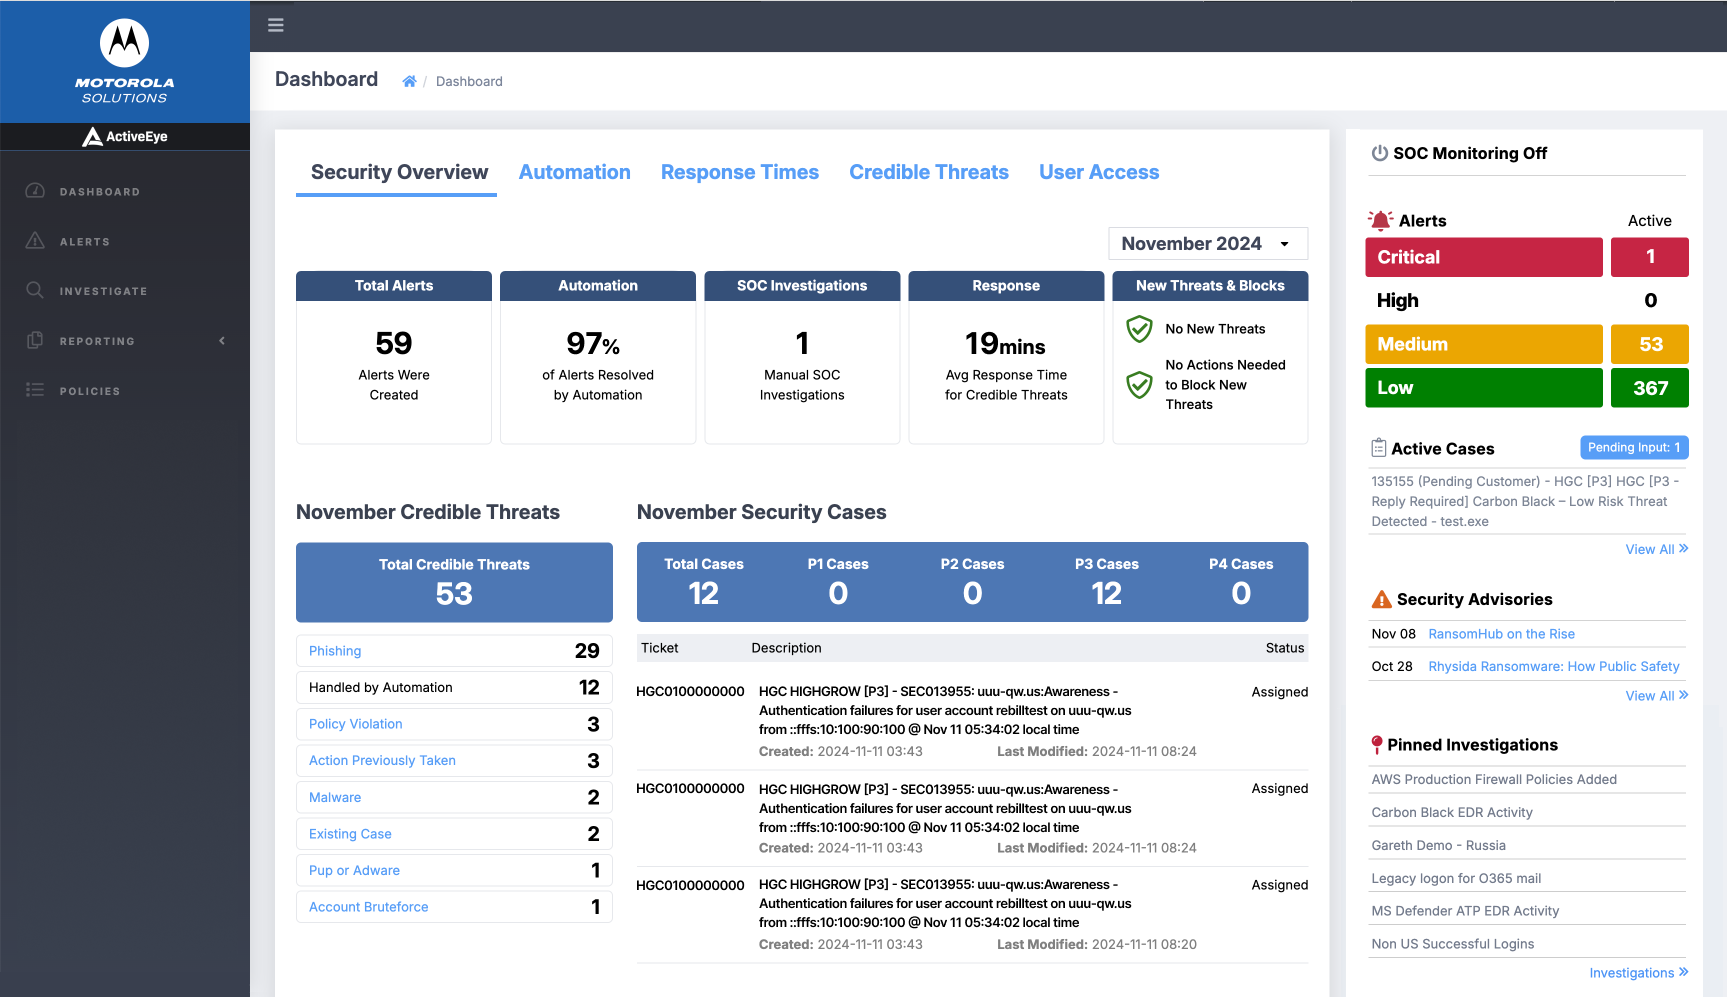
The basic functions of each major area of the Dashboard page are as follows. Each will be discussed in more detail in subsequent sections of this topic.
- Dashboard Content Tabs: The five tabs at the top of the Dashboard can be selected to display associated summary information in the main content area. The specific interactive elements and links available in these areas will be discussed in a subsequent section.
- Main Content Area: Summary information related to the selected Content Tab is displayed here, with interactive elements and links that can be used for further investigation.
- Active Alerts: This section displays the number of active alerts in each category: Critical, High, Medium, and Low. You can click the row for any category to open a new page with additional information about the relevant alerts.
- Active Security Cases: This section displays Security Cases that are currently active and under investigation by the ActiveEye team, and indicates whether any of the cases are currently pending input. Clicking View All opens a new browser tab where the last 10 cases can be seen on the Cases page.
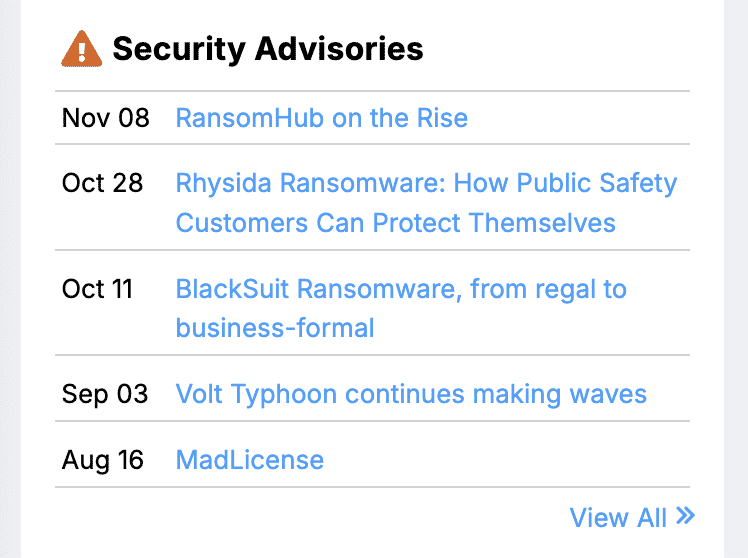
- Security Advisories: Security Advisories are informational messages created by the ActiveEye team to alert you to any specific security concerns that could affect your organization or the industry at large. Click a link in the section to read the full advisory, or click View All to access the Service Advisories page, where you can view past advisories.
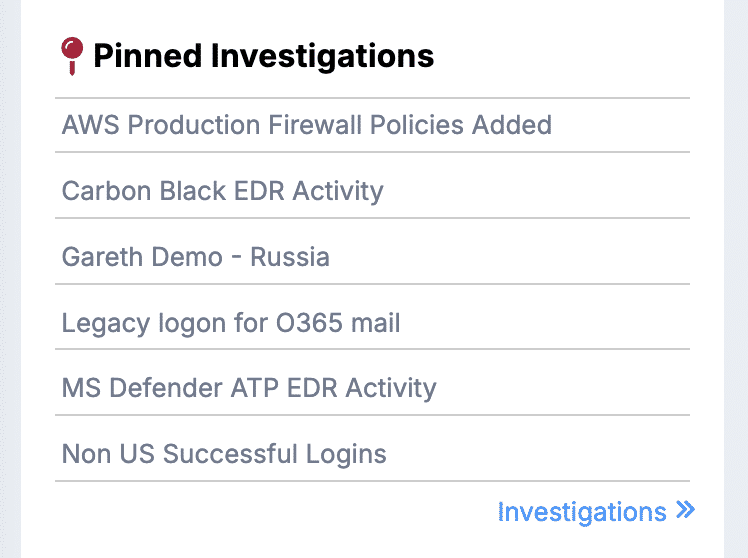
- Pinned Investigations: Investigations that have been pinned using the investigation interface appear in this section. Click the name of an investigation in the list to access a new page with detailed information.
The Security Overview section
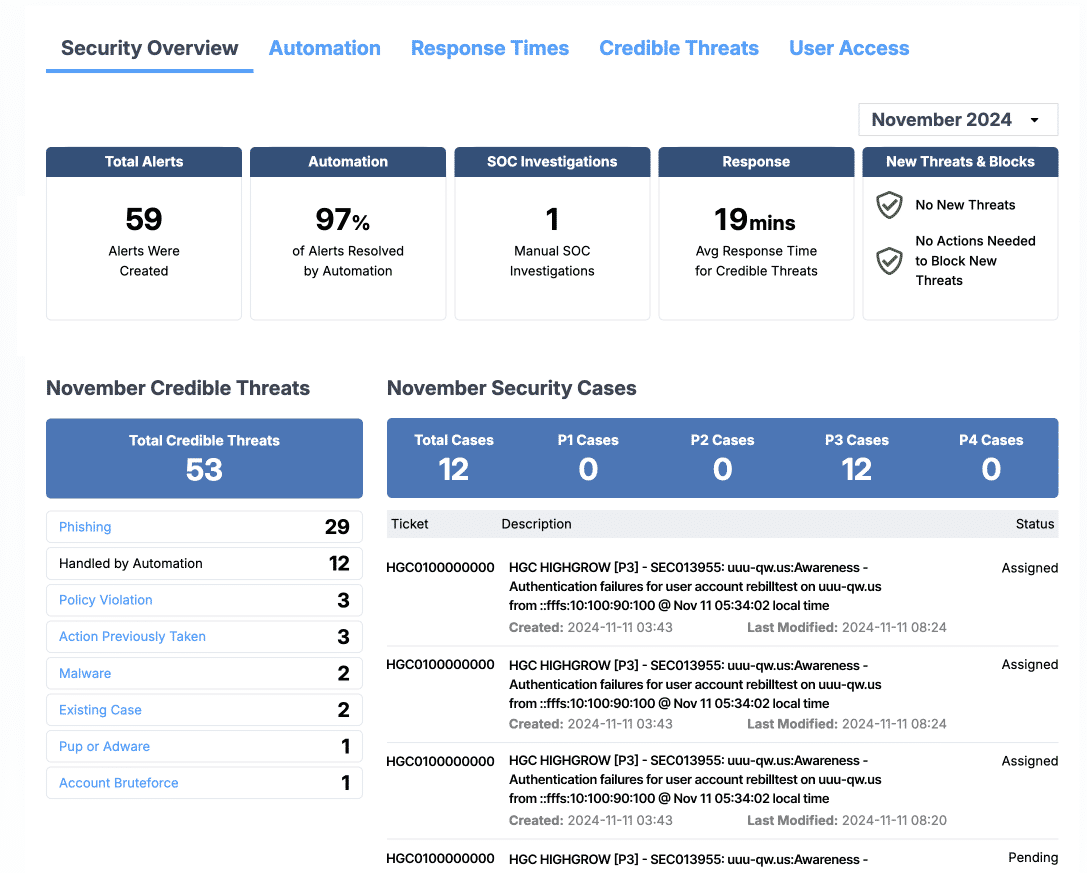
The Security Overview section displays top-level information about ActiveEye alert and credible threat volumes, as well as the SOC investigations and security cases associated with handling threats. This section provides links to credible threat alerts so that you can quickly drill-down for additional information. You can select a different month using the month picker, allowing for quick data comparison.
The functions of each major area of the Security Overview section are as follows.
- Month Selector: Use this tool to select the month whose Security Overview information you want to display.
- Total Monthly Alerts: The Total Alerts module displays the total count of alerts that were created in the chosen month.
- Monthly Automation: The Automation module highlights the number of alerts handled automatically by the ActiveEye system in the chosen month.
- Monthly SOC Investigations: The SOC Investigations module displays the count of alerts that were handled by a human analyst in the chosen month.
- Monthly Response Time: The Response module displays the average time taken to respond to alerts that were considered credible threats in the chosen month.
- New Threats & Blocks: The New Threats & Blocks module provides insight into the selected month's credible threats, if any, and how many were prevented from running in the network. You can click the New Threats link to access the File Threats page, which catalogues threats and response actions taken by the SOC. You can click the Threats Prevented from Running button to access additional details on the Alerts page. If there are no new threats or threats prevented from running in the selected month, green shield icons will appear in this module.
- Monthly Credible Threats: The Credible Threats section breaks out alerts considered to be credible threats in the chosen month. Credible threats are alerts for which a ticket was created and/or response action was taken. In the section, credible threats are listed based on threat type. You can click the links in this section to see additional information about the specific alerts of each threat type.
- Monthly Security Cases: The Security Cases section breaks out customer cases for the chosen month, showing how many cases of each priority level exist. Below the chart, existing cases are listed with information including ticket number, a description of the case, and case status. This is a convenient way to access high-level information about cases on the main Dashboard page.
The Automation section
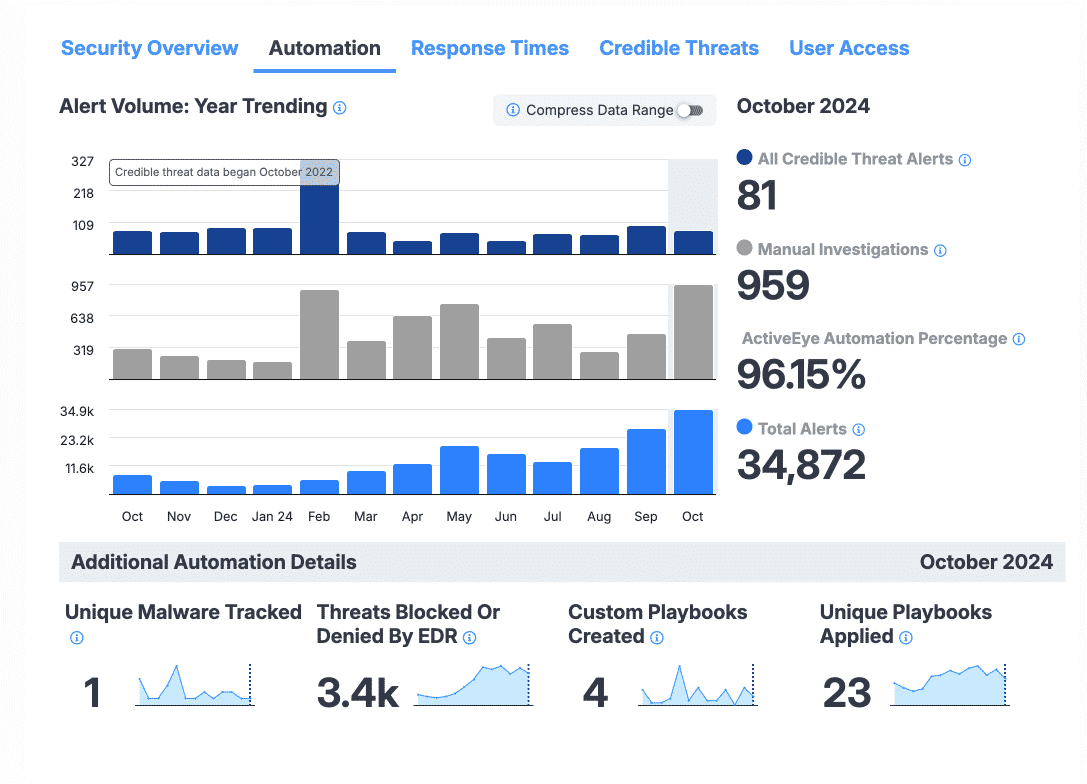
The Automation section displays information about ActiveEye alerts and how they were handled, whether by ActiveEye automated processes or manual intervention by analysts. The charts provide a visual comparison of alert generations in the last 13 months, and the other elements in the Automation section display specific information about the selected month. You can select a different month simply by hovering over the month in any chart, allowing for quick data comparison.
The functions of each major area of the Automation section are as follows.
- All Credible Threat Alerts Chart: The All Credible Threat Alerts chart displays the number of alerts that were identified as credible threats by ActiveEye analysts in each of the last 13 months. Credible threats are alerts for which a ticket was created and/or response action was taken. By default, the current month is selected (October 2024 in this example). By hovering your cursor over a different month in any of the charts, the information displayed in the Automation section will be updated to the data for that month, allowing for easy comparison. To the right of the chart, the count of credible threat alerts for the selected month is displayed.
- Manual Investigations Chart: The Manual Investigations chart displays the number of alerts in each of the last 13 months that required manual investigation by an ActiveEye analyst. The hover-to-switch-month feature can also be used in this chart. To the right of the chart, the count of manually investigated alerts for the selected month is displayed.
- Total Alerts Chart: The Total Alerts chart displays the total number of alerts in each of the last 13 months that were handled by ActiveEye. The hover-to-switch-month feature can also be used in this chart. To the right of the chart, the total count of alerts handled by ActiveEye for the selected month is displayed.
- ActiveEye Automation Percentage: Percentage of alert volume handled by the ActiveEye platform itself. This includes both automated investigations and customer preference playbooks.
- Unique Malware Tracked: The Unique Malware Tracked module displays the number of distinctive malware types detected and tracked by the SOC in your environment in the selected month.
- Threats Blocked or Denied by EDR: The Threats Blocked or Denied by EDR module displays the number of threats blocked by EDR in your environment in the selected month. The SOC curates and manages watch lists to stop threats before they become alerts.
- Custom Playbooks Created: The Custom Playbooks Created module displays the number of playbooks created by the SOC specifically for your environment in the selected month. You can roll over the chart to see the peaks and valleys.
- Unique Playbooks Applied: The Unique Playbooks Applied module displays the number of playbooks created by the SOC that generated at least one alert in your environment in the selected month.
- Compress Data Range: The Compress Data Range toggle allows you to switch between linear and nonlinear scaling in the three charts that appear in the section. Turning this toggle on allows for wider ranges of numbers to be viewed in the charts, which can be useful for visualizing trends.
The Response Times section
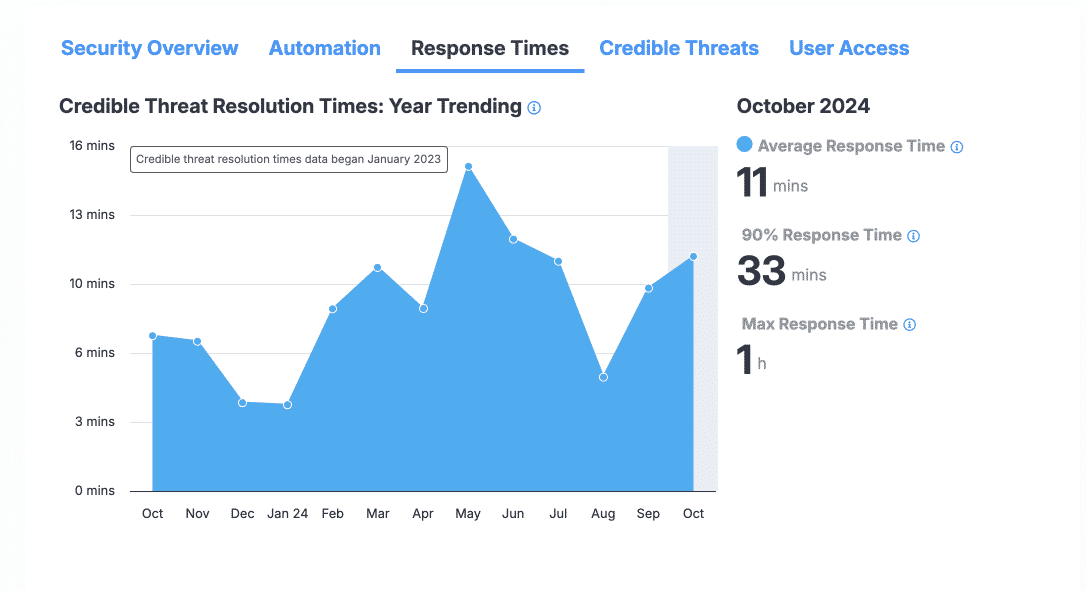
The Response Times section displays information about the time taken to resolve alerts that were identified as credible threats by ActiveEye analysts. Resolution time is calculated from the time the alert is generated in ActiveEye to the final determination made regarding the alert. The chart provides a visual comparison of average resolution times in the last 13 months, and the other elements in the section display specific information about the selected month. You can select a different month simply by hovering over the month in any chart, allowing for quick comparison of resolution time data.
The functions of each major area of the Response Times section are as follows.
- Average Response Time: The average response time for credible threats in the selected month.
- 90% Response Time: In the selected month, 90 percent of all credible threats were resolved in this amount of time or less. This value can be helpful in understanding whether there any credible threats that took longer than average to resolve.
- Max Response Time: The maximum time it took to resolve a credible threat in the selected month.
The Credible Threats section
The Credible Threats section provides 13-month trending data for credible threats. For the selected month, the total number of each threat type is displayed, alongside the percentage of credible threats attributed to that threat type. Reviewing this section can be helpful in understanding the types of threats that attack your system most.
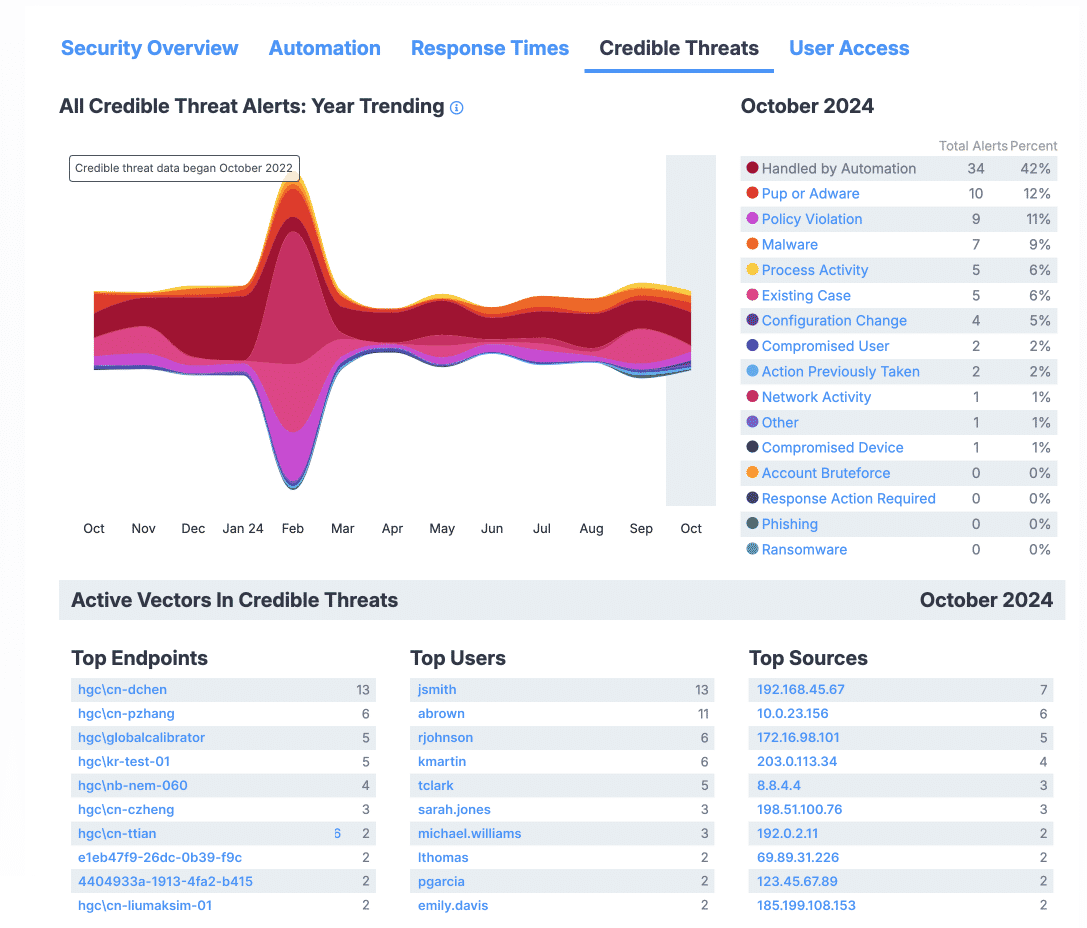
The functions of each major area of the Credible Threats section are as follows.
- All Credible Threat Alerts: Year Trending Table: This chart visualizes the alerts that were identified as credible threats by ActiveEye analysts in each of the last 13 months. The chart is color-coded, coordinated with the colors used to designate credible threat type in the Alert Type Details section.
- Month Selection: As seen in previous sections, you can hover your cursor over any month in the chart to select it, and the information displayed in the section will be updated to the data for that month.
- Alert Type Details: This list details types of credible threats generated in the selected month, displaying the count of each credible threat type, and the percentage of that month’s credible threats that were that type.
- Top Endpoints: This list displays the endpoints that were active vectors for alerts identified as credible threats in the given month. The number of credible threats associated with each endpoint is given, and the list is sorted highest-count-first.
- Top Users: This list displays the users that were active vectors for credible threats in the given month. The number of credible threats associated with each user is given, and the list is sorted highest-count-first.
- Top Sources: This list displays the sources that were active vectors for credible threats in the given month. The number of credible threats associated with each source is given, and the list is sorted highest-count-first.
The User Access section
The User Access section displays information about successful and failed login attempts to your system in the past 30 days. You can hover your cursor over a country in the map to reveal detailed information pertaining to that country. Use this section to quickly understand where login attempts to your system originate.
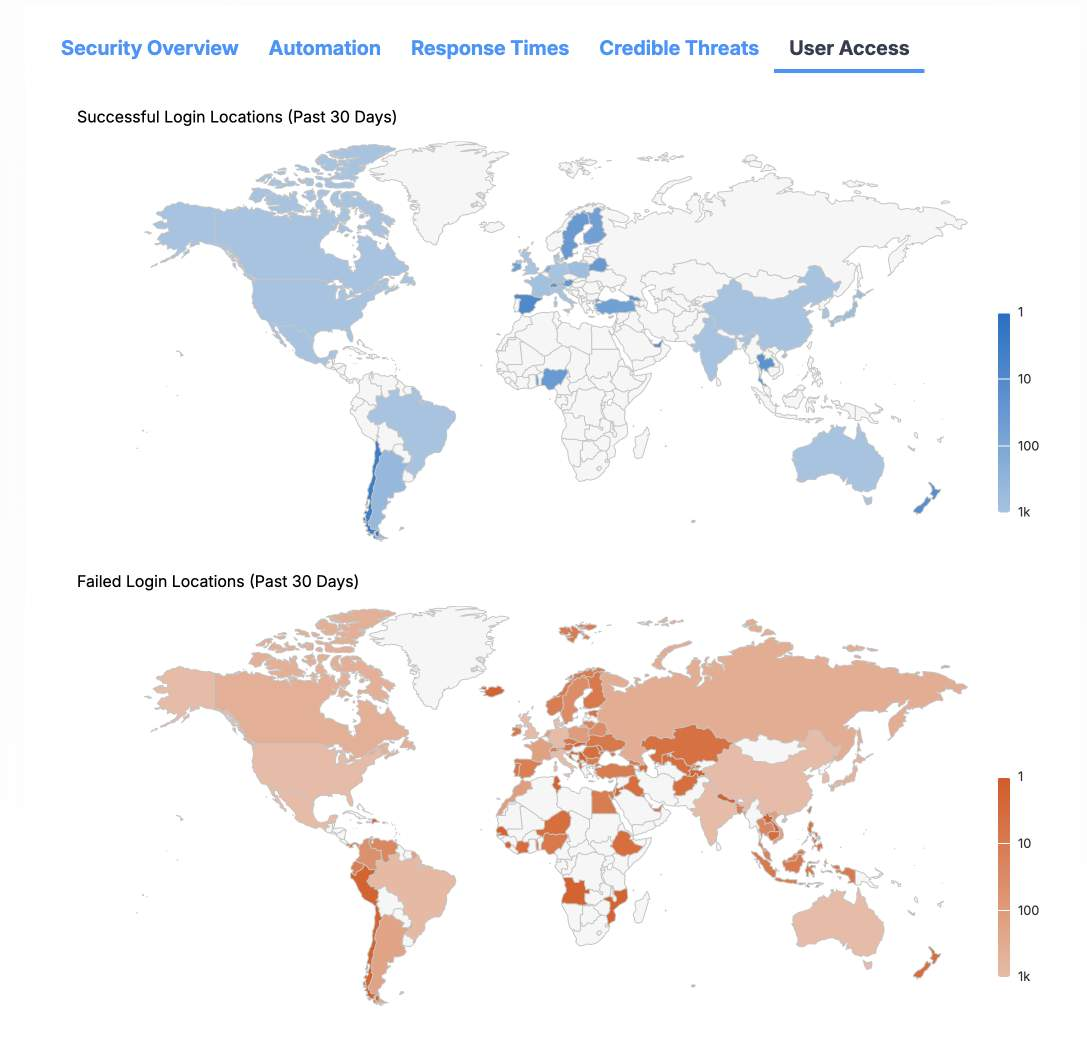
The functions of each major area of the User Access section are as follows.
- Successful Login Locations Map: This map displays countries that were the origin of successful login attempts in the last 30 days. In the map, no successful logins originated from gray-shaded countries. Hover over any blue-shaded country to display the specific count of successful login attempts originating in that country.
- Successful Login Locations Scale: This scale indicates the number of successful logins originating in each country. The lighter the shade of blue used to fill the country on the map, the more successful logins originated from that country. This information can be useful in identifying any successful login attempts originating from unexpected countries.
- Failed Login Locations Map: This map displays countries that were the origin of failed login attempts in the last 30 days. In the map, no failed logins originated from gray-shaded countries. Hover over any orange-shaded country to display the specific count of failed login attempts originating in that country.
- Failed Login Locations Scale: This scale indicates the number of failed logins originating in each country. The lighter the shade of orange used to fill the country on the map, the more failed login attempts originated from that country. This information can help identify unauthorized attempts to access your system.
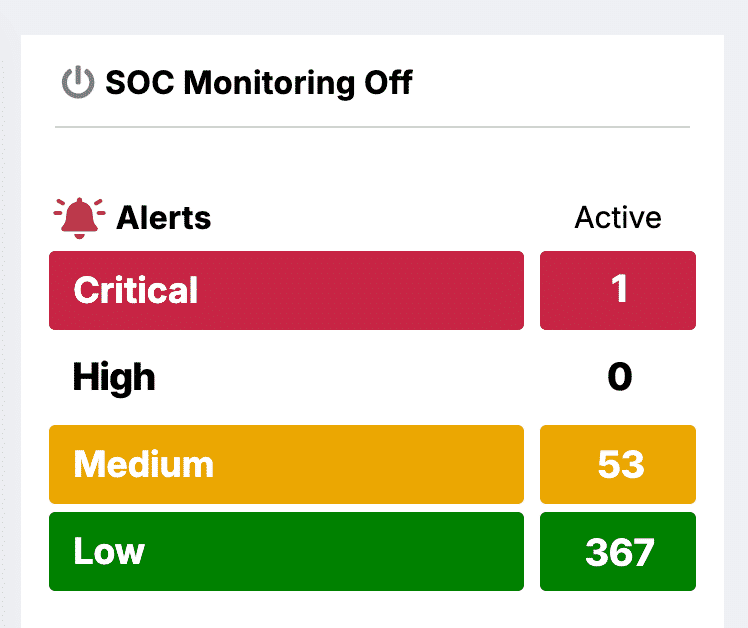
Active security alerts
This prominently positioned section displays the counts of currently active security alerts, broken down into the four severity categories. The symbol in the upper-left corner of the section indicates whether SOC Monitoring is active: a green symbol indicates that it is active, a gray symbol indicates that it is not. Click the row for any severity category to open a page where you can view details about the alerts in that category.
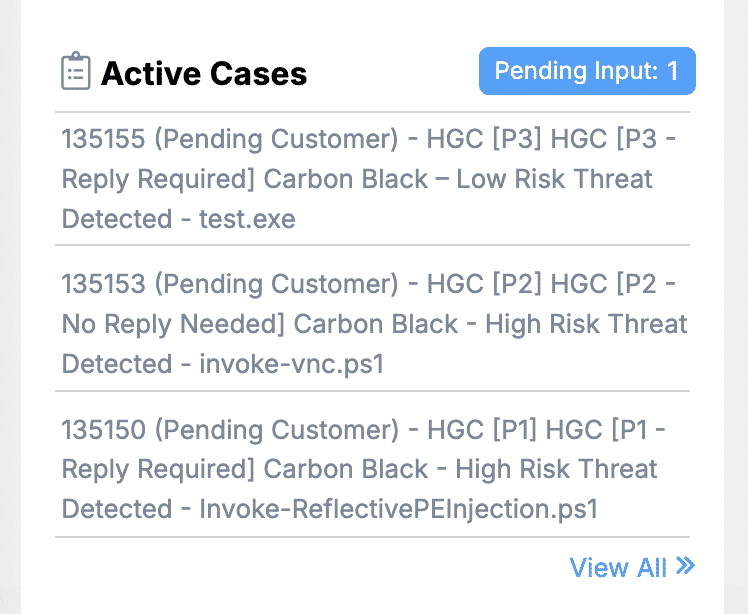
Active security cases
This section displays a list of currently active security cases. Security cases are opened by either the customer or an ActiveEye analyst in response to a security alert or customer request.
Cases will remain active and appear in this section until they reach the closed state in the Case Management Tool.
Note that ActiveEye only displays the cases. ActiveEye is not the system of record and does not manage the case itself. To view the content of the case, please visit the Motorola Customer Hub.
Security advisories
Security Advisories are brief, informative articles published by the Motorola Threat Research team. They are intended to disseminate timely security information on active threats.
Security Advisories include a summary of the advisory, technical information, potential mitigations, and links that can be followed for more information.
It's important to note that not all advisories are relevant to every environment. These are general advisories that summarize the entire landscape of potential threats.
Pinned investigations
Investigations are queries designed to answer specific questions based on collected event data.
The ActiveEye platform allows users to design an investigation, and then pin it to the Dashboard.
By pinning the investigation, users are able to launch the investigation with one click, directly from the Dashboard. In this way, you can quickly answer the questions that are most important to you with minimal navigation.
In addition to pinning an investigation to their own Dashboard, users can also share pins across the organization so that others can benefit from them.
Accessing the ActiveEye Insight view of the Dashboard
The ActiveEye Insight page is a read-only, highly visible view of the Dashboard designed for wall-mounted screens and lobby monitors. It presents a continuously updating summary of alert activity, security case statuses, and trend metrics without requiring any user interaction after accessing the page. The ActiveEye Insight page automatically refreshes every 15 minutes. When values are updated, they are animated with a brief flash to draw attention to unattended screens.
- To access the ActiveEye Insight page, on any page in ActiveEye, in the upper-right corner of the screen, click your email address, and then, in the menu that appears, click Kiosk.
The ActiveEye Insight page appears.
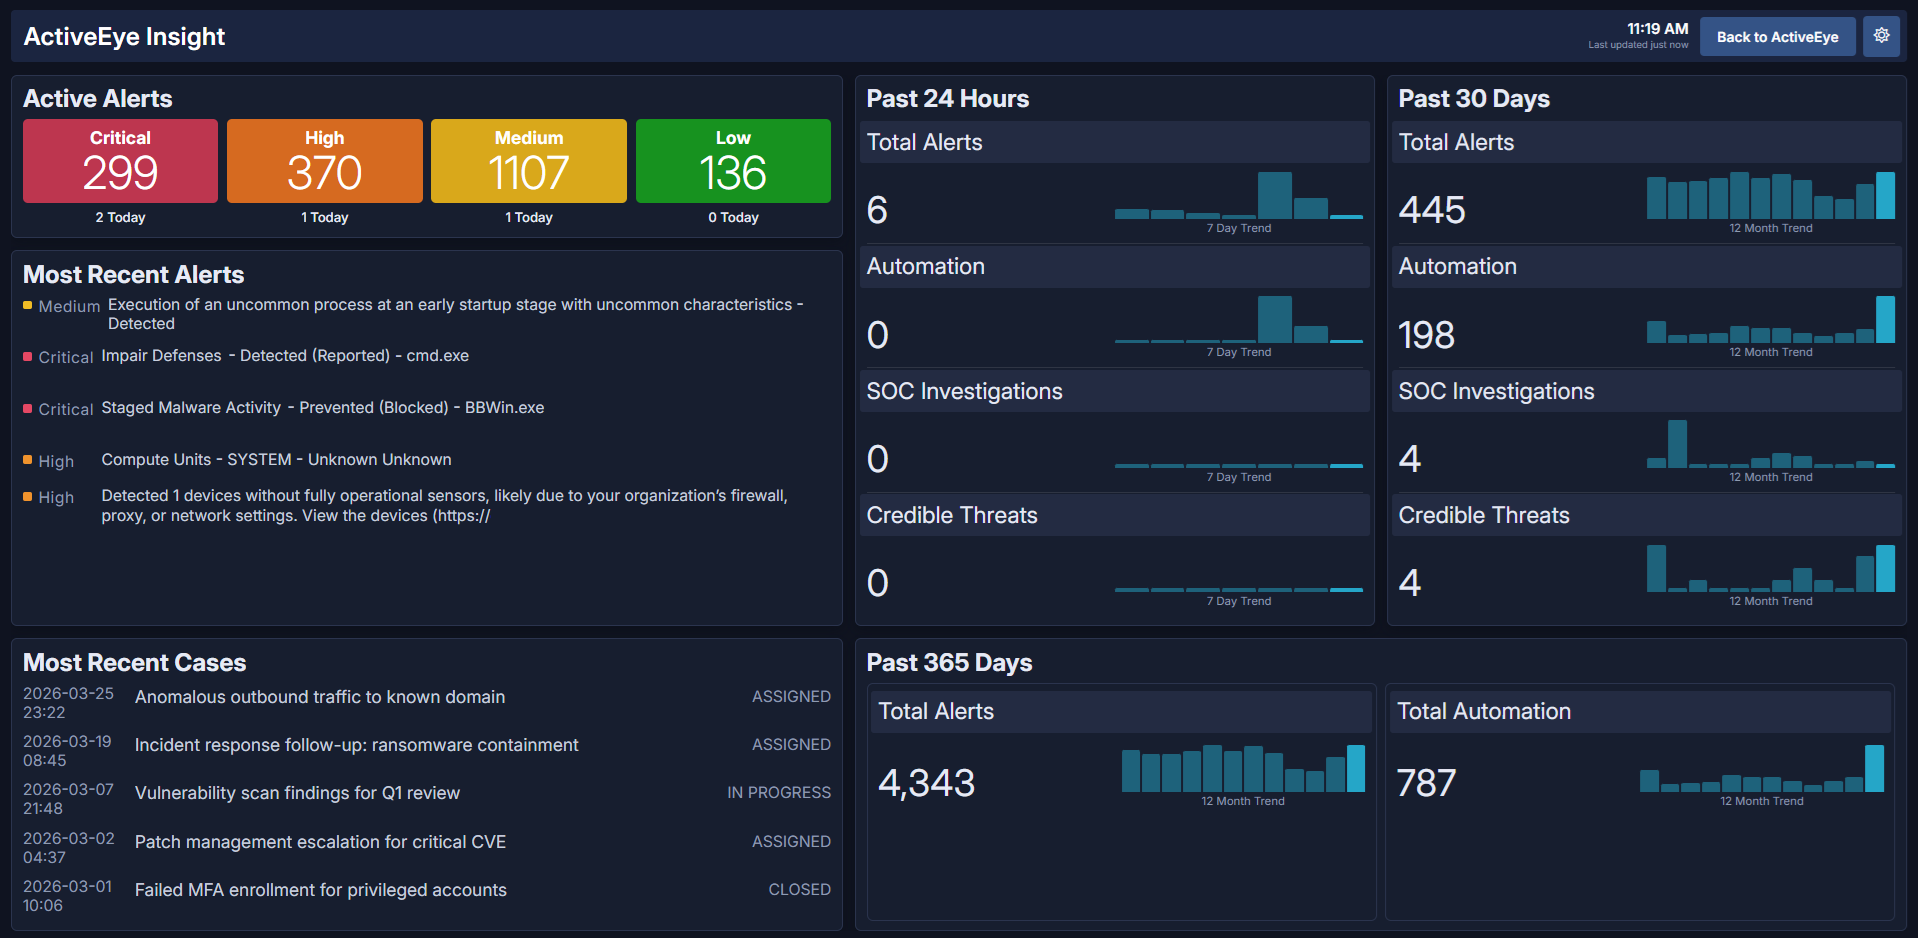
This page displays the following information:- Active Alerts: This section displays the number of active alerts in each category: Critical, High, Medium, and Low. Below each total, the number of alerts generated on the current date is displayed.
- Most Recent Alerts: This section displays the severity categories and messages of the five most recently generated alerts.
- Most Recent Cases: This section displays the dates, titles, and statuses the five most recently created security cases.
- Past 24 Hours: This section displays the total number of alerts generated in the past 24 hours, the number of those alerts handled by automation, the number of those alerts requiring manual SOC investigations, and the number of those alerts that were considered credible threats. Each metric is presented alongside a chart showing the seven-day trend in activity.
- Past 30 Days: This section displays totals for alerts generated in the past 30 days, each presented alongside a chart showing the 12-month trend in activity.
- Past 365 Days: This section displays the total number of alerts generated in the past 365 days, with a chart showing the 12-month trend in activity.
- Total Automation: This section displays the total number of alerts handled by the ActiveEye platform through automation in the past 365 days, with a chart showing the 12-month trend in activity.
- Last updated: In the upper-right corner of the page, below the clock, this message indicates when the page was last automatically refreshed.
- To switch the ActiveEye Insight page between its dark theme and light theme, in the upper-right corner of the page, click the
 button.
 - To return to the standard view of the Dashboard, click the
 button.